Digital Productivity, Online planners, Planners
Google Sheets Social Media Content Planner: Free Template
Apr
Okay so I literally just finished setting up a social media content planner in Google Sheets for a client last week and honestly? It’s kinda changed how I think about free templates because I’ve been paying for Notion and all these fancy tools when you can basically do everything in Sheets.
Why I Actually Started Using Google Sheets for This
So here’s the thing – I was juggling like three different social media scheduling tools and my cat knocked over my coffee right as I was trying to sync everything and I just thought, why am I making this so complicated? Google Sheets is free, it’s already connected to everything Google, and you can share it without people needing to sign up for yet another platform.
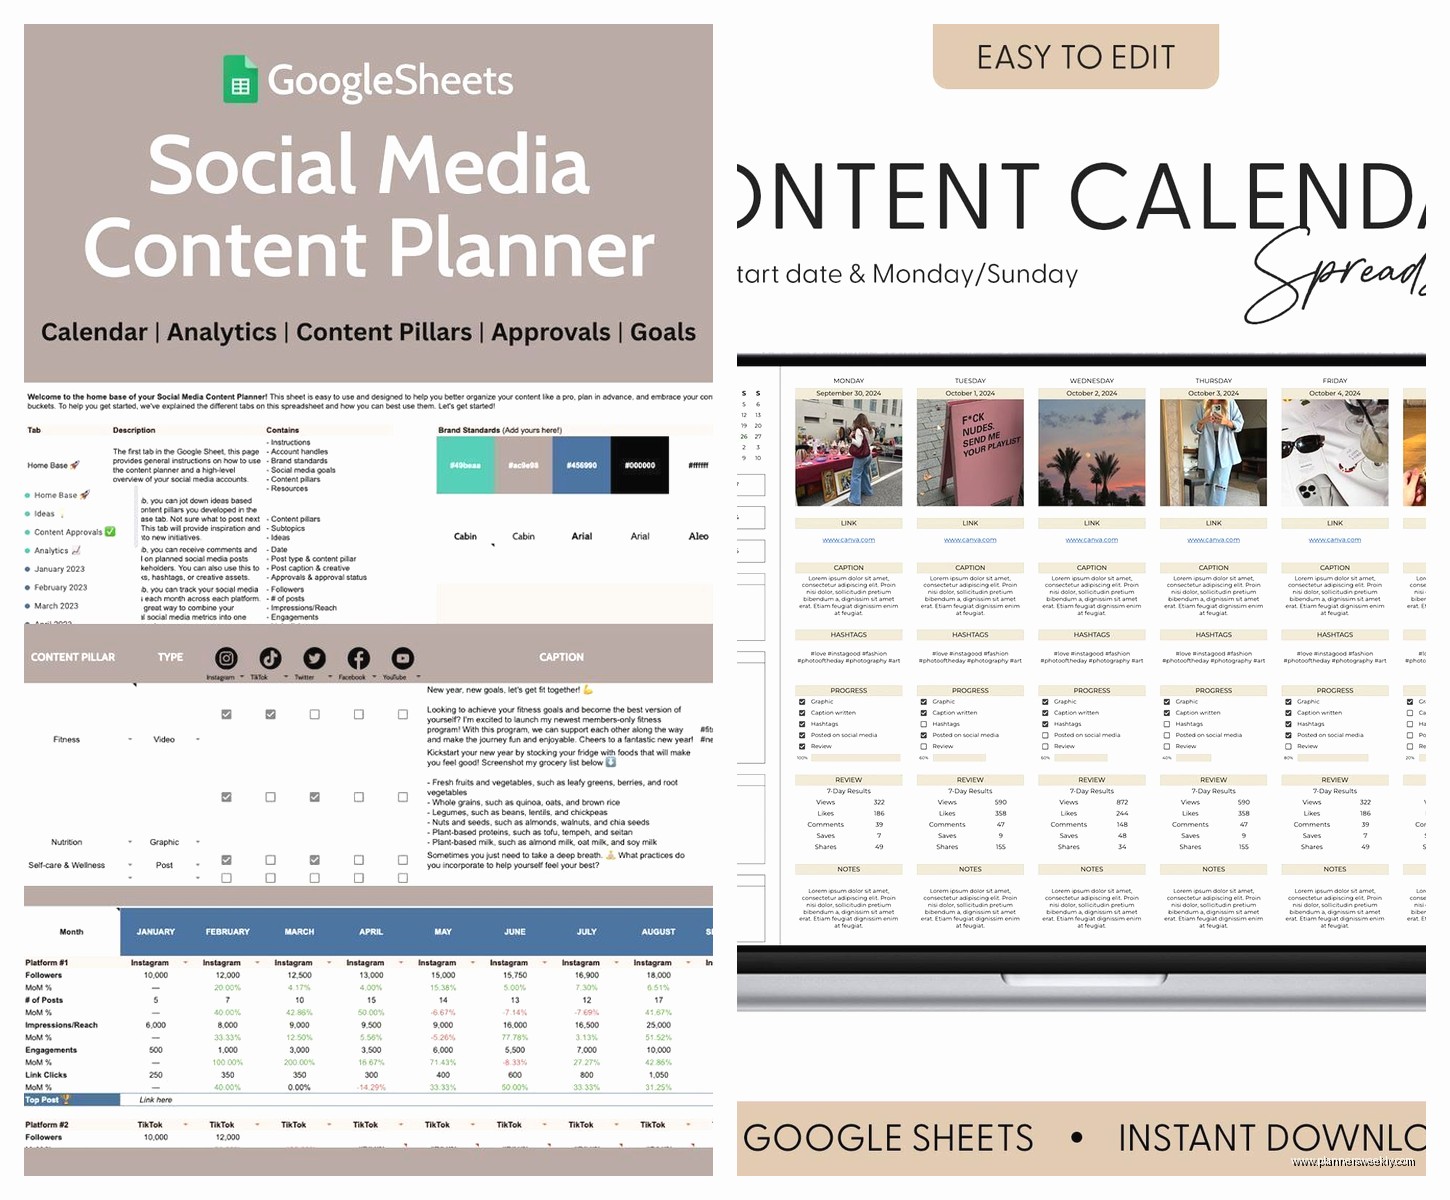
The template I built has five main tabs and I’m gonna walk you through each one because the structure actually matters more than you’d think.
Tab One: Content Calendar Master View
This is your main dashboard basically. I set mine up with columns for:
- Date (duh)
- Platform (Instagram, LinkedIn, Twitter, whatever you’re using)
- Content Type (carousel, single image, video, story)
- Topic/Theme
- Status (Draft, Scheduled, Posted, Needs Revision)
- Performance Notes
The performance notes column is something I added after like two weeks of using this because I kept forgetting which posts actually did well. Now I just jot down “got 50 comments” or “crickets lol” so I can spot patterns.
Oh and another thing – use data validation for the Status and Platform columns. Click on the column, go to Data > Data Validation, and set up a dropdown list. Trust me, it keeps everything clean and you can filter way easier later. I learned this the hard way after typing “instagram” like five different ways (Instagram, insta, IG) and then my filters were useless.
Color Coding That Actually Helps
I use conditional formatting to color-code the status column. Green for posted, yellow for scheduled, red for drafts that are overdue, white for upcoming. To set this up: select your Status column, Format > Conditional Formatting, then set rules based on text contains. It sounds fussy but takes like 3 minutes and then you can see at a glance what needs attention.
Tab Two: Content Ideas Dump
This tab is basically organized chaos. I have three columns: Idea, Platform Best For, and Priority. Whenever someone says something interesting in a meeting or I see a trending topic, I dump it here. My client actually canceled last Tuesday so I spent an hour just filling this tab with content ideas while watching that baking show – you know the one with the tents?
The Priority column uses numbers 1-3. One means “do this ASAP,” three means “maybe someday if I run out of ideas.” Simple system but it works.
Tab Three: Platform Specifications
Okay this is gonna sound weird but this tab has saved me SO much time. I created a reference sheet with all the image sizes, character limits, and best posting times for each platform. Because honestly who can remember that Instagram carousels are 1080×1080 but LinkedIn images should be 1200×627?
My columns are:
- Platform
- Image Size (main feed)
- Image Size (stories/reels)
- Character Limit
- Hashtag Limit
- Best Times to Post (I update this quarterly based on my analytics)
- Notes (like “Link in bio only” for Instagram)
I keep this tab open on my second monitor when I’m actually creating content. No more googling “twitter character limit 2024” for the millionth time.
Tab Four: Hashtag Research
Wait I forgot to mention this earlier but hashtags are weirdly important and I kept losing track of which ones performed well. So tab four is divided by platform, then by category.
For Instagram, I have categories like:
- Productivity (my main niche)
- Stationery
- Small Business
- Engagement Pods (don’t judge me, they kinda work)
Under each category, I list 20-30 hashtags with their approximate size (like #productivity is huge, #bulletjournalcommunity is medium). I also note which ones got me the most engagement in a separate column. This way when I’m scheduling a post about planners, I just copy-paste from my tested hashtag sets instead of starting from scratch.
Pro tip: use the CONCATENATE function or just the & symbol to combine hashtags into one cell. Like if cells A1-A10 have your hashtags, in another cell type =A1&” “&A2&” “&A3 and so on. Then you can copy the whole string at once. Saves so much time.
Tab Five: Analytics Tracker
This is where you track what’s actually working because creating content without checking performance is like… I dunno, buying stationery and never using it. Which I’ve definitely never done. Ahem.
My columns here are:
- Post Date
- Platform
- Content Type
- Topic
- Reach
- Engagement (likes + comments + shares)
- Link Clicks (if applicable)
- Engagement Rate (I calculate this with a formula)
- Notes
The engagement rate formula I use is: =(Engagement/Reach)*100. So if cell E2 has your engagement and F2 has your reach, in the engagement rate column you’d put =(E2/F2)*100. Format that column as percentage and boom, you can see which posts actually connected with people.
I update this monthly, not after every single post because ain’t nobody got time for that. Usually I pour some tea, sit down with my analytics, and spend like 45 minutes updating everything.
Making It Actually Usable
Okay so funny story – I built this entire template and then realized I hated looking at it because it was just walls of data. Here’s what made it actually pleasant to use:
Freeze the header row. View > Freeze > 1 row. Now when you scroll down, you still see your column headers. Game changer.
Adjust column widths. Double-click the line between column letters and it auto-fits to your content. Or manually drag to make important columns wider.
Use filters. Click on your header row, then Data > Create a Filter. Now you can filter by platform, status, date range, whatever. This is how you actually find stuff later.
Protect certain tabs. If you’re sharing this with a team, you can protect your reference tabs (like platform specs and hashtag research) so people don’t accidentally mess them up. Right-click the tab > Protect sheet > Set permissions.
The Scheduling Workflow I Actually Follow
Every Sunday (okay fine, sometimes Monday morning when I forget) I do a content planning session. Opens the Master Calendar tab, looks at the week ahead, checks my Content Ideas tab for inspiration. I fill in topics and themes for the week, mark them as “Draft” status.
Throughout the week, I create the actual content and change status to “Scheduled” once it’s loaded into whatever scheduling tool I’m using. I use Later for Instagram and Buffer for everything else, but the Google Sheet is my source of truth. Everything gets logged here first.
Once something posts, I update the status to “Posted” and jot down immediate observations in the performance notes. Did it go up at the right time? Any obvious typos I missed? Did people actually engage or was it crickets?
Advanced Features I Added Later
After using the basic template for like a month, I got fancy and added some stuff that’s actually been super helpful.
Checkboxes for Task Management
I added a column called “Image Created” with checkboxes (Insert > Checkbox). Now I can see at a glance which posts still need graphics. Same for “Caption Written” and “Scheduled.” It’s satisfying to check them off, not gonna lie.
Linked References
On my Master Calendar tab, I linked back to my Platform Specs tab so I can quickly check image dimensions without switching tabs. You can do this by typing = then clicking the cell you want to reference from another tab. Creates a formula like =PlatformSpecs!B2 which pulls that data automatically.
Monthly Overview with Charts
I created a sixth tab (okay so it’s not five tabs anymore, sue me) with a monthly overview. Used pivot tables to summarize how many posts I did per platform, and added simple bar charts to visualize it. Makes it easy to show clients what I’ve been doing. To make a pivot table: Data > Pivot Table, then drag fields around until it looks right. There’s a learning curve but YouTube has a million tutorials.
Common Mistakes I Made So You Don’t Have To
Not dating things properly. Use actual date formatting (Format > Number > Date) instead of just typing dates as text. This lets you sort chronologically and use date-based filters. I spent an embarrassing amount of time figuring out why my dates weren’t sorting correctly before I realized this.
Making columns too narrow. Give yourself room to write actual notes, not just codes. My Performance Notes column is like 300 pixels wide because detailed observations are way more useful than “good” or “bad.”
Forgetting to share properly. If you’re working with a team or a VA, make sure you set sharing permissions correctly. Click the Share button, add their email, and choose between Viewer, Commenter, or Editor access. I once gave someone view-only access and then got annoyed they weren’t updating the sheet. Oops.
Not backing up. Google Sheets auto-saves but I still download a copy as Excel monthly, just in case. File > Download > Microsoft Excel. Keep it in your backup folder.
Customizing for Your Specific Situation
The template I described works for me as a productivity coach with a stationery focus, but you’re gonna need to adjust it. If you’re doing a ton of video content, add columns for video length and thumbnail status. If you’re heavy on Instagram Stories, maybe track story views separately. If you’re managing multiple brands, add a “Brand” column so you can filter.
Oh and another thing – if you’re managing content for clients, I’d recommend creating a separate Sheet for each client rather than just adding tabs. Keeps everything cleaner and you can share individual Sheets without exposing other clients’ data.
The Stuff I Still Use Other Tools For
Just to be real with you, I don’t use Google Sheets for actual scheduling. I still schedule posts through Later and Buffer because they have better mobile apps and I can see preview layouts. The Sheet is for planning, tracking, and reference. It’s my command center but not my execution tool.
I also still use Canva for creating graphics because obviously Sheets can’t do that. But I do keep a column in my Master Calendar with links to the Canva designs so I can find them again later. Just paste the Canva share link into a column called “Design Link” and you’re set.
Analytics still come from the actual platforms – Instagram Insights, LinkedIn Analytics, whatever. But I manually transfer the important numbers to my Analytics Tracker tab so I have everything in one place for comparison.
How to Actually Get Started Today
Open Google Sheets. Create a new blank spreadsheet. Name it something like “Social Content 2024” or whatever year it is when you’re reading this.
Create your five tabs: Master Calendar, Content Ideas, Platform Specs, Hashtag Research, Analytics. Start with the Master Calendar – just set up those basic columns I mentioned earlier. Don’t try to build the perfect system on day one, you’ll get overwhelmed and quit.
Fill in your Platform Specs tab with the platforms you actually use. Google the current image dimensions and character limits, write them down. This takes like 10 minutes and immediately makes your life easier.
Start logging your content ideas. Even if you only write down three ideas, that’s three more than you had documented before. The template gets more useful the more you use it, not by being perfect from the start.
Set a reminder to update it weekly. I literally have a recurring task in my to-do list that says “Update content planner” every Sunday at 4pm. Otherwise I forget and then the whole thing becomes useless.
That’s basically it. Nothing fancy, just organized chaos in spreadsheet form. It’s not gonna make you go viral or anything but it’ll stop you from forgetting what you posted last week or scrambling for hashtags at the last minute. And honestly? That’s worth way more than whatever I was paying for those other tools.