Digital Productivity, Online planners, Planners
Capacity Planning Template Guide: Excel & Free Resources
Mar
Okay so I just spent the last three weeks building capacity planning templates for like five different clients and honestly the Excel ones are where it’s at if you actually want something that works. Not the fancy project management software that costs three hundred dollars a month, just good old spreadsheets.
The Basic Excel Template You Actually Need
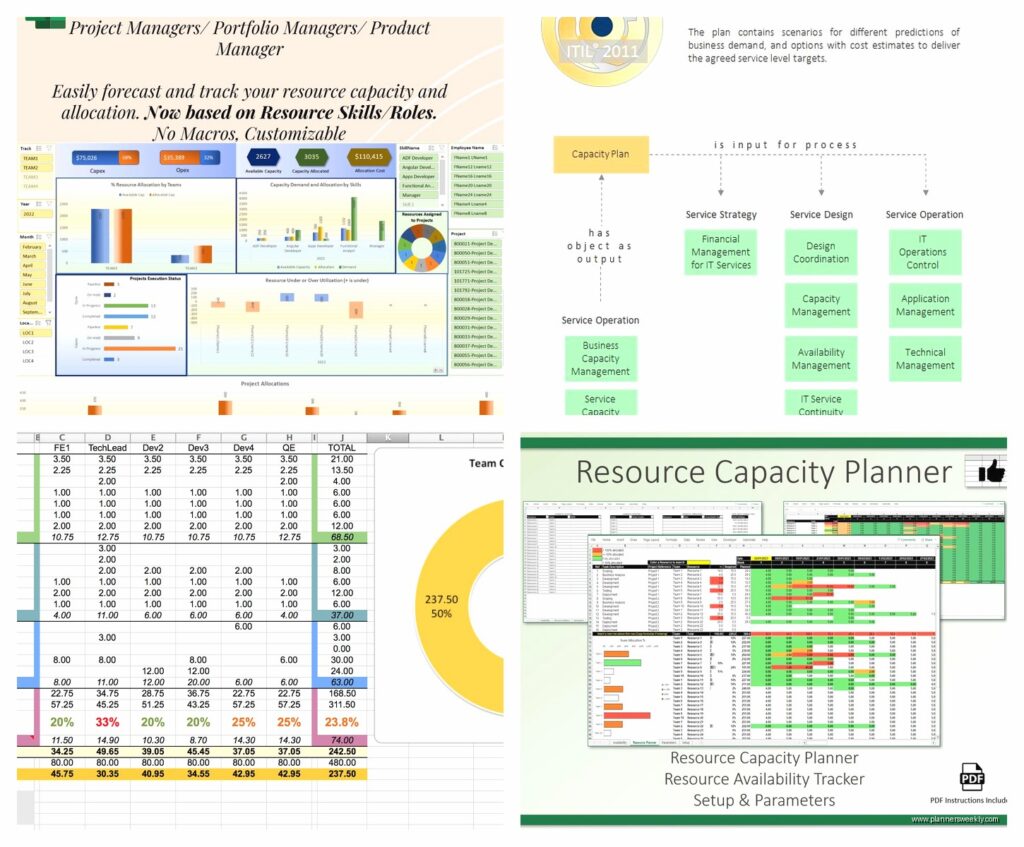
Right so the simplest version that I literally use every single day is just a grid. Team member names down the left column, weeks or months across the top, and then you fill in the hours or percentage of capacity. Super basic but here’s the thing nobody tells you about capacity planning templates – they break down the second you make them too complicated.
I learned this the hard way when I built this massive color coded thing with conditional formatting and dropdown menus and my client took one look at it and was like yeah we’re never gonna update this. So now I start with the bones and add complexity only if they’re actually gonna use it.
For the basic template you need these columns minimum:
- Resource name (people, equipment, whatever)
- Total available hours per week
- Current allocation percentage
- Project assignments
- Available capacity remaining
The formula for that last one is dead simple: Total Available minus Current Allocation equals What’s Left. But you’d be shocked how many templates I’ve downloaded that don’t actually calculate this automatically.
Where To Actually Find Free Templates That Don’t Suck
So I’ve tested probably thirty different free capacity planning templates over the past year and most of them are honestly garbage. They’re either way too simple like just a blank table with no formulas, or they’re trying to do everything and they have macros that break when you open them on a Mac.
The best free one I found is from Vertex42. It’s an Excel template that has both resource capacity planning and project timeline stuff built in. You can download it and actually use it without having to rebuild the whole thing. The formulas work, the formatting isn’t hideous, and it has instructions that make sense.
Microsoft also has templates in their Office template library but honestly they’re hit or miss. I downloaded one last month that looked perfect in the preview but when I opened it half the formulas were circular references and I spent like an hour trying to fix it before I gave up.
The Smartsheet Free Template Situation
Okay so Smartsheet offers free templates but here’s the catch – you need a Smartsheet account to use them and the free version is pretty limited. That said, if you’re already using Smartsheet for other stuff, their capacity planning template is actually really good. It has built-in resource management views and you can set up alerts when someone hits like 80% capacity.
I used it for a client project in January and the automatic notifications were clutch because the project manager kept overallocating people and didn’t realize it until the spreadsheet literally emailed her.
Building Your Own Excel Template From Scratch
If none of the free ones work for your situation which honestly happens a lot you’re gonna need to build your own. I know that sounds intimidating but it’s really not that bad once you get the structure down.
Start with a new Excel workbook and create tabs for different views. I usually do:
- Resource Overview (the main capacity view)
- Project List (all active projects with requirements)
- Monthly Summary (rolled up numbers for leadership)
- Assumptions (where you document how you’re calculating stuff)
That last tab is SO important and nobody does it. Six months from now you’re not gonna remember why you divided certain numbers by 0.8 or whatever adjustments you made for holidays. Write it down.
The Formula Setup That Actually Works
For the main capacity calculation I use this approach and it’s worked across like fifteen different organizations at this point. In your Resource Overview tab set it up like this:
Column A is the person’s name. Column B is their total available hours which is usually 40 hours per week times 52 weeks but you gotta adjust for PTO and holidays. I use 1,920 hours per year as the baseline for a full-time person which accounts for about three weeks off.
Then columns C through whatever are your projects. Each cell shows how many hours that person is allocated to that specific project. At the end you have a SUM formula that adds up all their project allocations.
The magic column is the one that shows Available Capacity as a percentage. The formula is: (Total Available Hours minus Sum of Allocations) divided by Total Available Hours. Format it as a percentage and use conditional formatting so it turns red when someone’s over 100% allocated.
Oh and another thing – I always add a buffer column where you can manually adjust someone’s available capacity. Because realistically nobody is 100% productive on project work. There’s meetings and emails and random stuff. I usually use 80% as the actual available capacity for planning purposes.
The Weekly vs Monthly View Debate
So this is where people get really worked up and honestly both approaches work depending on your situation. Weekly views are better if you have short projects and things change a lot. Monthly views are better for longer term planning and they’re easier to maintain because you’re not updating every single week.
I personally use monthly for capacity planning and weekly for actual project scheduling. They’re related but different things and trying to do both in one template makes it too complicated.
My dog just knocked over my water bottle all over my desk which is honestly on brand for how this week is going but anyway.
Setting Up a Monthly Capacity Template
For monthly planning your columns are months obviously. January, February, March across the top. Then for each person and each month you show either their allocation percentage or actual hours, pick one and stick with it because mixing them gets confusing fast.
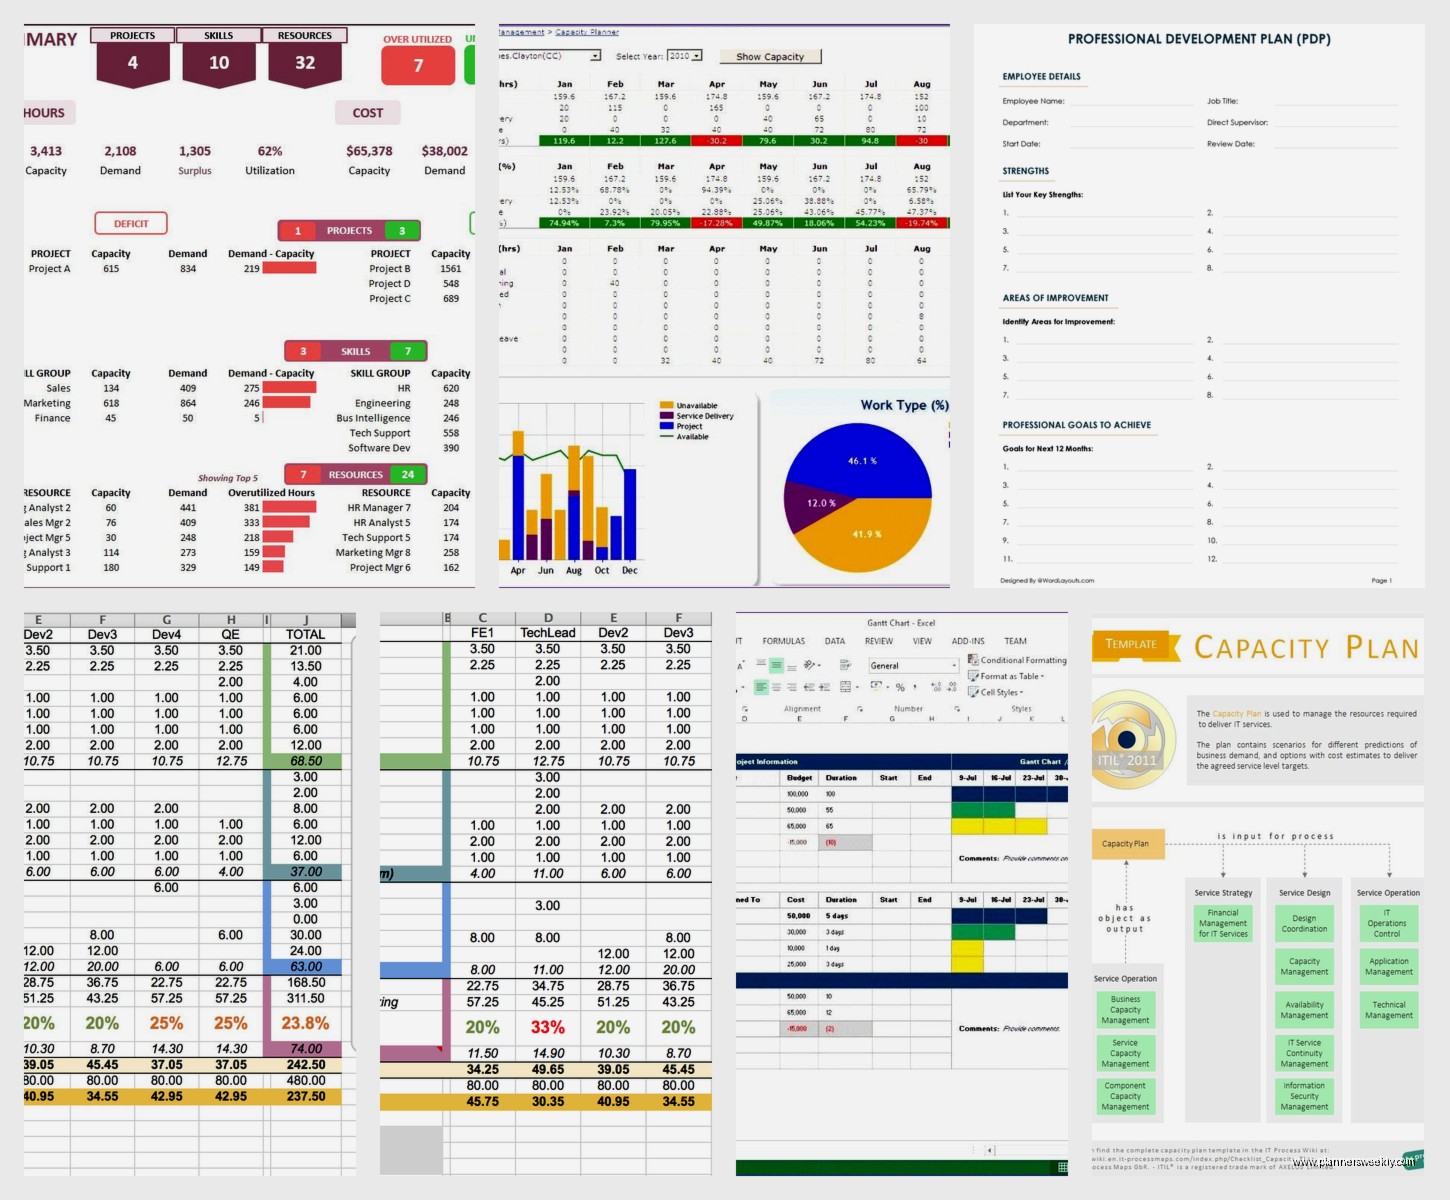
I prefer percentages for high level capacity planning because it’s easier to see at a glance that someone is at 110% capacity vs they have 176 hours allocated. Your brain processes the percentage thing faster.
The monthly view also lets you see trends over time which is super valuable. You can spot when you’re gonna have capacity crunches coming up and actually do something about it instead of just scrambling when you get there.
Adding Visual Elements That Actually Help
Okay so conditional formatting is your friend here but don’t go overboard. I see templates all the time that have like seven different colors and nobody knows what any of them mean.
My standard color scheme:
- Green: under 70% capacity (available for more work)
- Yellow: 70-90% capacity (getting full but not critical)
- Orange: 90-100% capacity (fully allocated)
- Red: over 100% capacity (problem that needs fixing)
That’s it. Four colors, clear meaning, you can understand the status of your team in like three seconds.
I also add simple bar charts that show capacity utilization by month. Excel makes this super easy with the Insert Chart function. Just select your data range and pick a stacked bar chart. It gives leadership something visual to look at instead of just numbers.
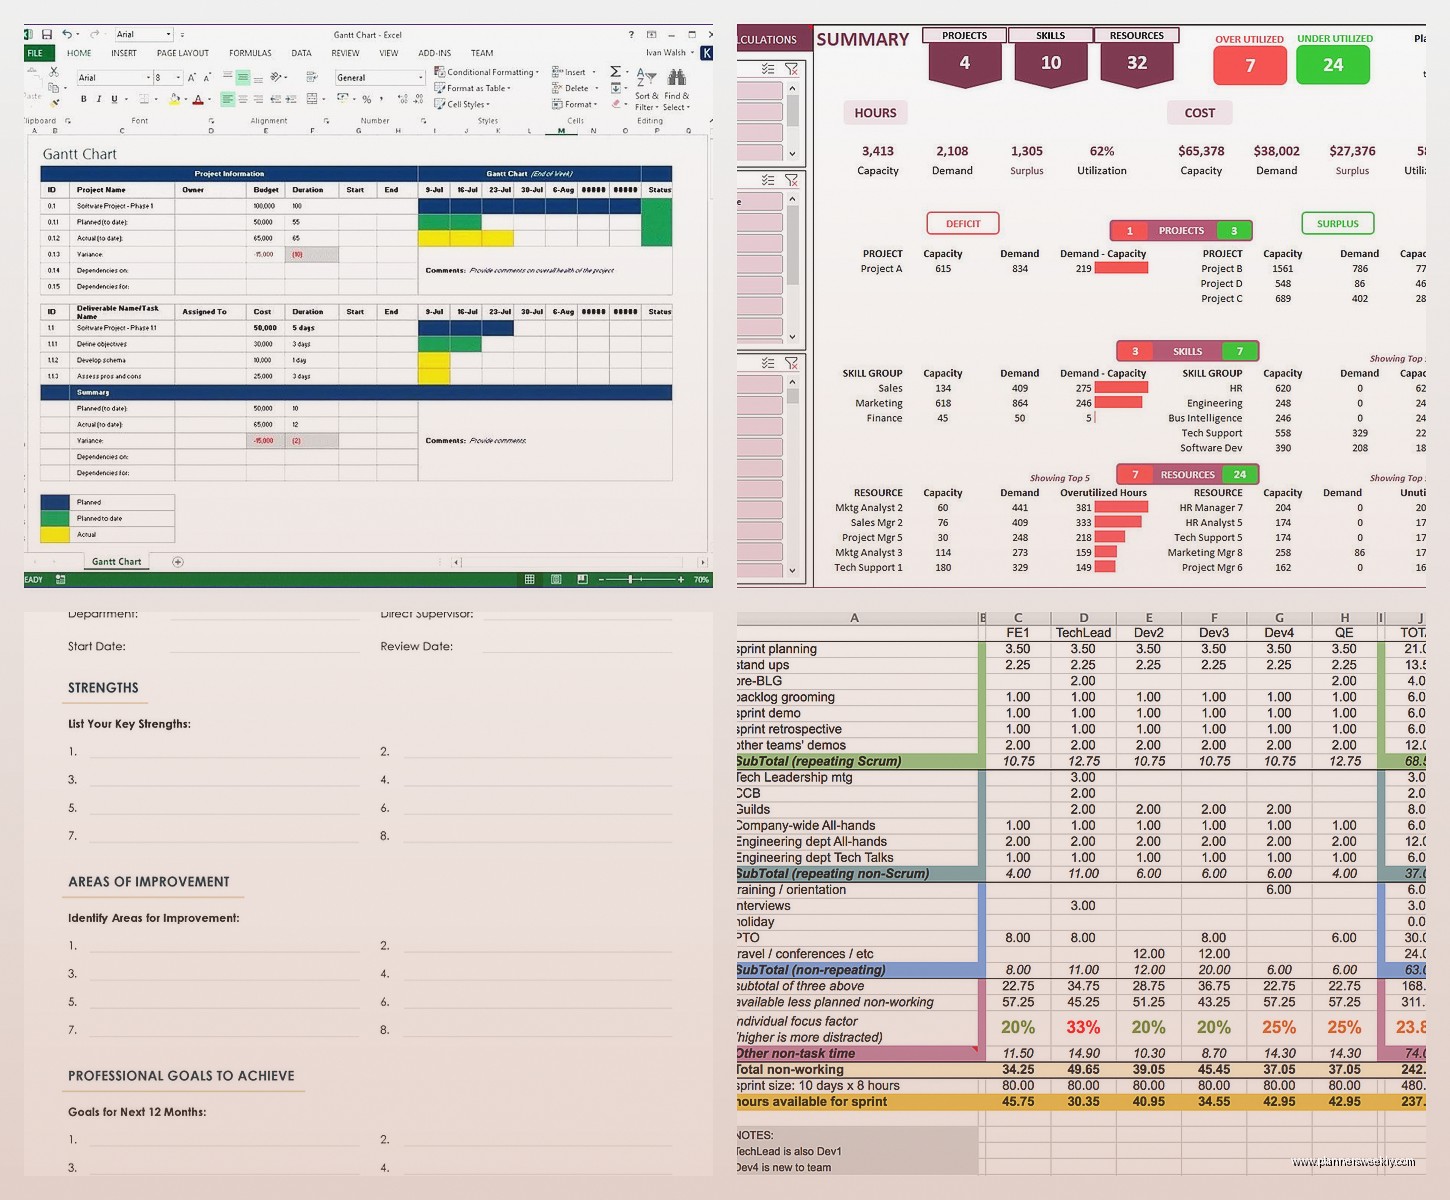
The Dashboard Tab Nobody Uses But Should
Wait I forgot to mention the dashboard tab. This is separate from your detailed capacity planning sheets and it just shows the key metrics. Average team utilization, number of people over capacity, available capacity hours for the next quarter, stuff like that.
The formulas pull from your main tabs so it updates automatically. I use AVERAGE, COUNTIF, and SUMIF functions mostly. Like COUNTIF counts how many people are over 100% allocated so you can see the problem magnitude at a glance.
Most people don’t build this tab but honestly it’s the thing that executives actually look at. They don’t wanna dig through your detailed resource allocation spreadsheet, they just wanna know if we have enough people or not.
Dealing With Part-Time People and Contractors
This is where capacity planning gets tricky and most templates don’t handle it well. You’ve got full-time people at 40 hours, part-time people at 20 hours, contractors who are only available certain months, people on multiple teams, it gets messy.
The way I handle this is with an adjustment factor column. So everyone has their base hours but then there’s a multiplier. Full-time person is 1.0, part-time person at 50% is 0.5, contractor who’s only available three months is 0.25 when you’re looking at the full year.
You gotta be really careful with contractors though because sometimes they’re budgeted as dollars not hours. I usually convert everything to hours for capacity planning purposes because you can’t compare hours and dollars in the same view, it doesn’t work.
The Shared Resource Problem
Okay so funny story, I built this elaborate capacity planning template for a client and we rolled it out and immediately three different departments started fighting because they all thought they had 100% of certain people’s time. Turns out nobody had documented who was actually on which team.
If you have shared resources and most organizations do you need a way to show their time split. I do this with a separate tab that lists each person and their team allocation percentages. Like Sarah is 60% Product Team and 40% Marketing Team. Then that feeds into the main capacity calculations.
Without this you end up with people allocated at like 200% because two different teams both think they have that person full-time. Not great.
Project Demand vs Available Capacity
Here’s where capacity planning actually becomes useful instead of just being a spreadsheet exercise. You need a way to compare what projects need vs what capacity you have.
I build this as a separate view that shows total demand by skill type or role and total available capacity by the same breakdown. The gap between them tells you where your constraints are.
Like maybe you have ten projects that need designers and those projects total 500 hours of design work per month but you only have 320 hours of design capacity available. That’s a 180 hour gap and now you know you need to either get more designers or descope some projects or push timelines.
The formula structure is basically SUMIF across your project requirements pulling all the hours needed for each role, then comparing that to your capacity by role. Excel pivot tables actually work really well for this if you set up your data right.
Rolling Wave Planning Approach
This is gonna sound weird but I don’t actually plan capacity in detail more than three months out anymore. I used to try to plan the whole year and it was such a waste of time because everything changed anyway.
Now I do detailed capacity planning for the next three months and rough planning for months four through twelve. The rough planning is just like “we’ll need approximately two engineers for Project X” without assigning specific people.
This saves SO much maintenance time on the template because you’re not constantly updating assignments six months in the future that are gonna change three times before you get there.
Free Google Sheets Alternatives
If you don’t have Excel or you need something collaborative that multiple people can edit at the same time, Google Sheets works fine for capacity planning. Most of the same formulas work and the conditional formatting is pretty similar.
The main advantage of Google Sheets is the sharing and real-time collaboration. Multiple people can update the template at the same time which is clutch if you have project managers who need to be adjusting allocations.
The disadvantage is that it’s slower with really large data sets. If you have like 200 people and 50 projects the calculations start to lag. Excel handles big spreadsheets better in my experience.
I’ve got a Google Sheets capacity template that I use for smaller teams and it works great. It has all the same structure as my Excel one just built in Sheets instead. You can literally copy an Excel template into Google Sheets and it’ll convert most of the formulas automatically.
The Real-Time Update Thing
One thing that’s cool about Google Sheets for capacity planning is you can set it up so project managers update their project requirements directly in the sheet and it automatically recalculates everyone’s capacity. No emailing spreadsheets back and forth.
You do need to protect certain cells though so people don’t accidentally delete your formulas. Google Sheets has a protect range feature where you can lock down the formula cells but leave the input cells editable.
I set this up for a client in March and it cut their capacity planning update time from like four hours a week to maybe thirty minutes because everyone could just update their own sections.
Skills-Based Capacity Planning
Most capacity templates just track people as generic resources but that doesn’t really work if you need specific skills. Like you can’t just throw any developer at any project, some projects need frontend developers and some need backend developers.
For skills-based planning you need an additional dimension in your template. I usually add a Skills tab that lists each person and their skill areas with proficiency levels. Then in the capacity view you can filter or group by skill to see capacity for that specific skill set.
This makes the template more complex obviously but for technical teams or creative teams where skills matter a lot it’s worth it. Otherwise you end up with available capacity on paper but it’s the wrong kind of capacity for your actual projects.
The Proficiency Level Question
Do you track proficiency levels like junior vs senior or do you just track skills as yes/no? I go back and forth on this honestly.
Proficiency levels are more accurate because a senior engineer can do work way faster than a junior engineer so their effective capacity is different. But it also makes the template more complicated to maintain.
My compromise is to use an efficiency factor. Junior people get 0.7 multiplier on their available capacity, mid-level gets 1.0, senior gets 1.3 or something like that. It’s not perfect but it’s better than treating everyone the same.